For a local service business in the United States, time is measured in dollars. When a homeowner’s basement is actively flooding, an HVAC unit gives out during freezing winter weather, or a vehicle owner is stranded on the shoulder of a highway, they are not browsing the web on a high-speed fiber desktop connection. They are on a smartphone, often with fluctuating mobile reception, desperate for an immediate solution.
If your website takes five, six, or eight seconds to load, that prospective customer will not wait. They tap the back button and call the next competitor in the Google Map Pack.
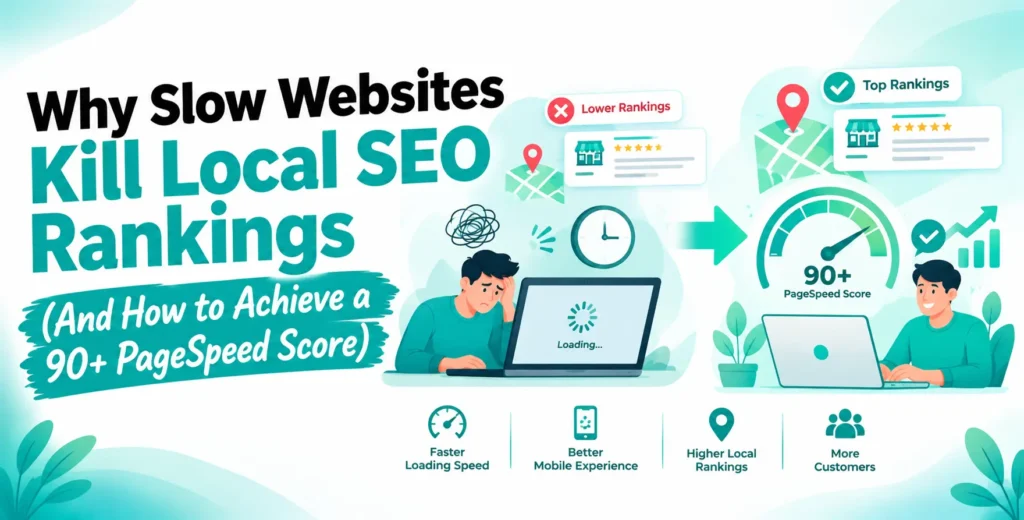
What many small business owners fail to realize is that slow page loading is not just an annoying user experience flaw it is a direct algorithmic penalty that suppresses your local search rankings.
Google’s search algorithms prioritize user satisfaction above all else. If your site triggers high bounce rates, sluggish interactive delays, or frustrating visual jumps, Google actively downgrades your organic visibility in favor of faster, cleaner competitors.
This in-depth guide breaks down the hidden mechanics connecting website speed to local search rankings, demystifies Google’s Core Web Vitals, and provides a battle-tested, step-by-step roadmap to achieve a 90+ PageSpeed score on both mobile and desktop.
The Direct Link: How Slow Page Speed Destroys Local SEO
To fix your website’s performance, you must first understand the two direct ways slow page speed diminishes your local market share: Algorithmic Ranking Demotions and Behavioral Conversion Drops.
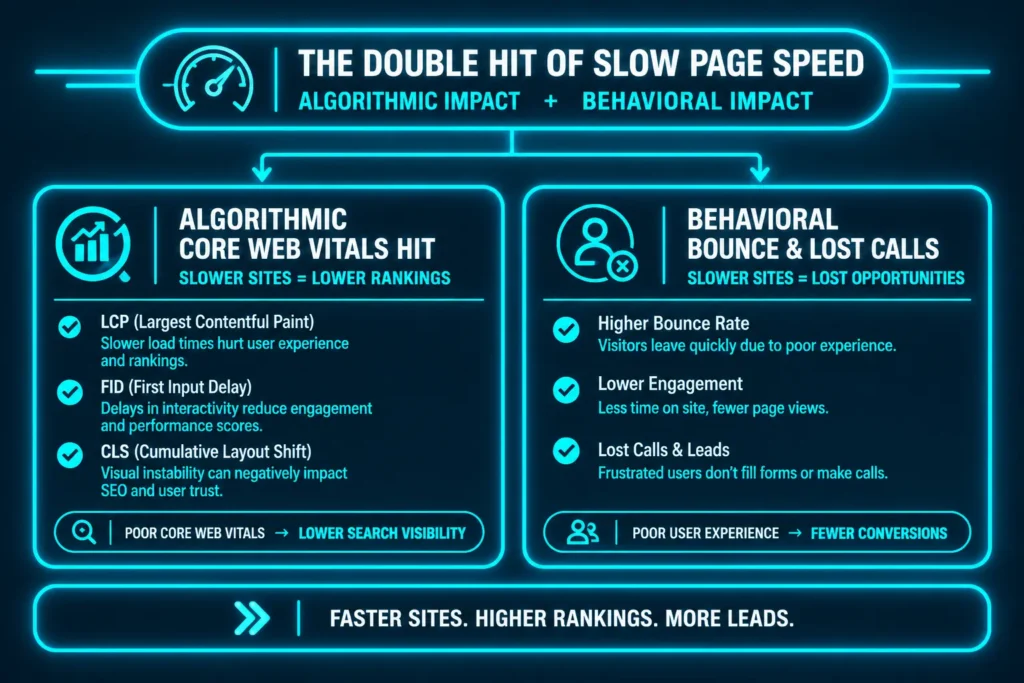
1. The Algorithmic Impact (Google Page Experience & Mobile-First Indexing)
Google has used page speed as a ranking factor for mobile searches for years, and it continues to refine its Page Experience signals.
When Googlebot crawls your local service landing pages, it measures how fast real users can view your primary content and interact with your site. If your technical metrics fail the thresholds, your site receives a lower ranking preference compared to competing sites with identical domain authority.
Furthermore, Google uses Mobile-First Indexing. It does not evaluate your site based on how quickly it loads on a high-end office Mac connected to Wi-Fi. It judges your website based on its performance on simulated mid-tier mobile hardware running on 4G cellular networks.
2. The Behavioral Impact (The Bounce & Pogo-Sticking Effect)
Search algorithms monitor user interaction signals. When a user clicks on your listing from the search results, encounters a white loading screen for four seconds, and immediately hits “back” to click your competitor’s listing, this behavior is known as Pogo-Sticking.
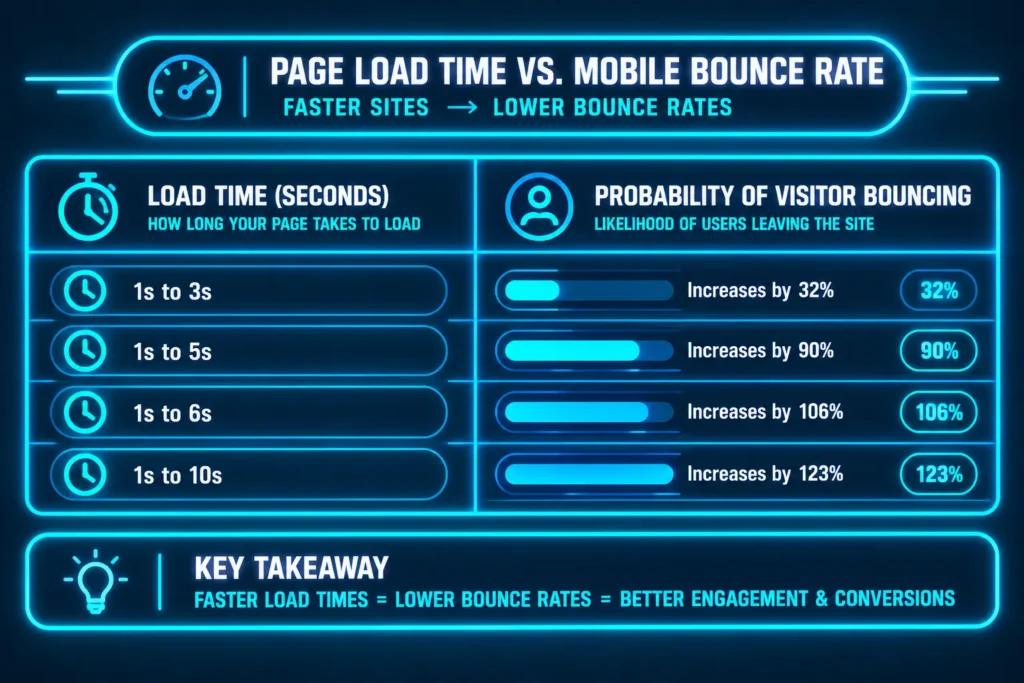
A continuous cycle of pogo-sticking signals to Google that your page failed to satisfy the user’s search intent. Over time, your search placements drop, dragging down your organic phone call volume with them.
Deconstructing Google’s Core Web Vitals (The Real Metrics)
You don’t need a computer science degree to understand why a website is slow. Google evaluates your site using three core operational metrics known as Core Web Vitals.
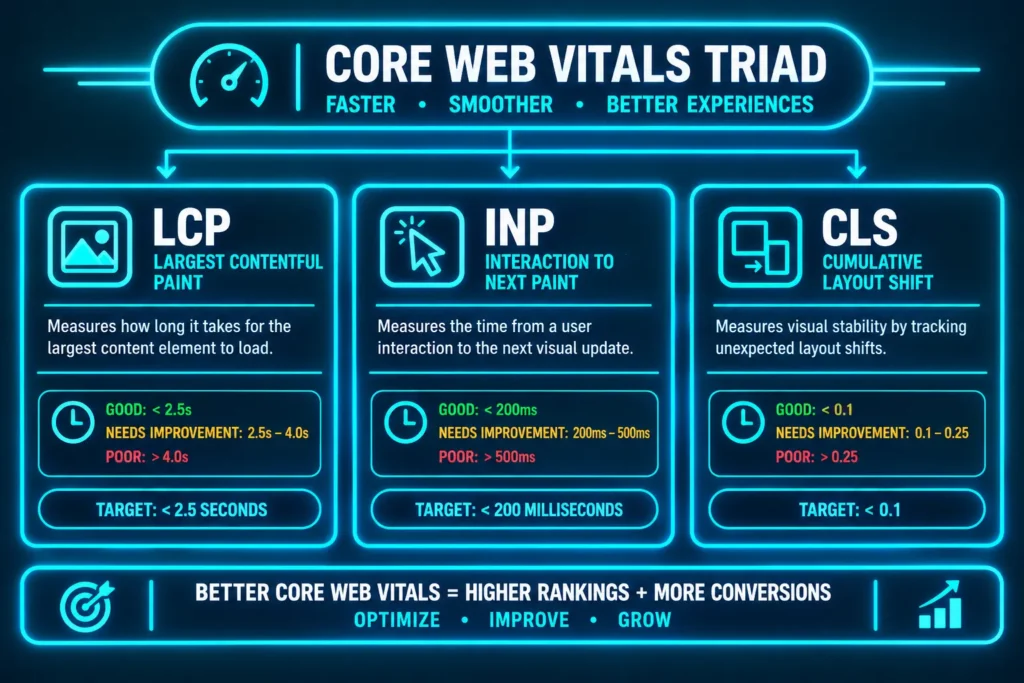
1. Largest Contentful Paint (LCP) – Loading Speed
- What it measures: The time it takes for the largest visual element on the screen (usually your hero background image, primary heading, or featured service graphic) to become fully visible.
- Google’s Standard:
- Good: Under 2.5 seconds.
- Needs Improvement: 2.5 to 4.0 seconds.
- Poor: Over 4.0 seconds.
2. Interaction to Next Paint (INP) – Responsiveness
- What it measures: How fast the page responds when a user interacts with it—such as tapping your “Call Now” button, opening the mobile navigation menu, or typing into an appointment form. INP represents the overall responsiveness of your site throughout the visitor’s entire session.
- Google’s Standard:
- Good: Under 200 milliseconds.
- Needs Improvement: 200 to 500 milliseconds.
- Poor: Over 500 milliseconds.
3. Cumulative Layout Shift (CLS) – Visual Stability
- What it measures: Whether elements on the page move around unexpectedly while loading. For example, if a user tries to tap your phone number, but an unoptimized banner ad or slow-loading graphic suddenly pops in and pushes the button down, causing them to tap the wrong element.
- Google’s Standard:
- Good: Score under 0.1.
- Needs Improvement: 0.1 to 0.25.
- Poor: Score above 0.25.
💡 Is Your Slow Website Costing You Calls?
Don’t let technical debt choke your local search visibility. Get a Full Diagnostic Speed & Core Web Vitals Audit performed by our engineering team.
5 Common Reasons Local Service Websites Fail PageSpeed Tests
When we audit local plumbing, HVAC, auto detailing, roofing, and electrical websites, we consistently see the same five technical mistakes dragging scores down into the red (0–49 range):
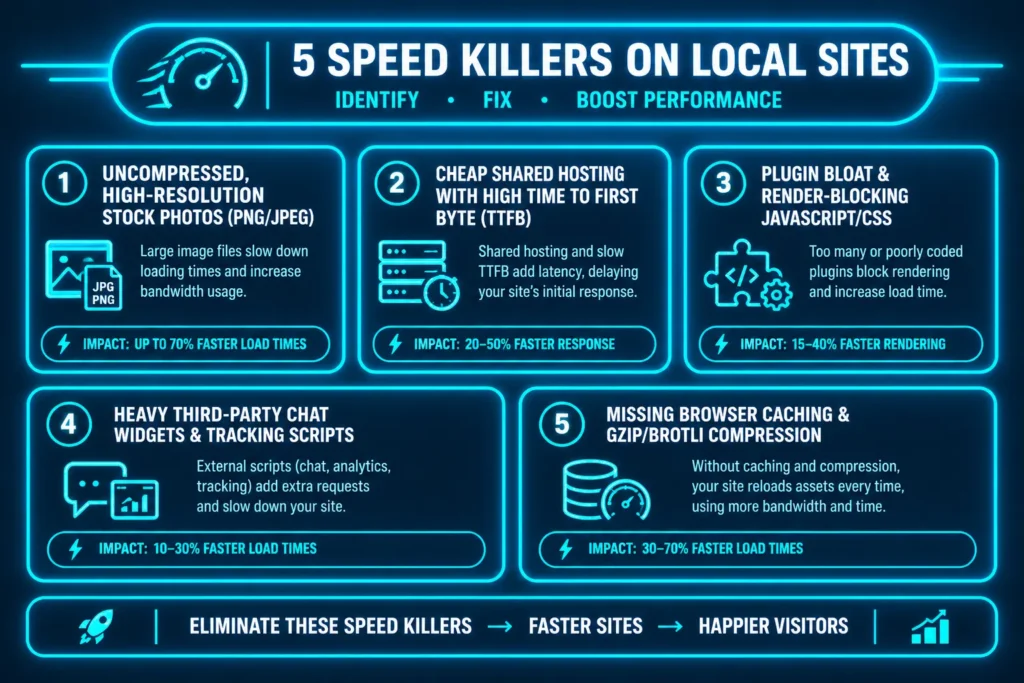
1. Massive, Uncompressed Imagery
A business owner takes a photo of their technician repairing a water heater or detailing a sports car with an iPhone or professional DSLR. They upload the raw 8MB JPEG directly into their website’s media library.
When a mobile visitor loads the page, their phone is forced to download multiple megabytes of data before rendering the screen. This single error destroys the LCP score immediately.
2. Low-Cost Shared Hosting (High TTFB)
Many small business owners sign up for $3.99/month shared hosting plans from generic hosting conglomerates. On shared servers, your site shares memory and CPU resources with thousands of other random websites.
If one site on that server experiences a traffic spike, your server response time (Time to First Byte or TTFB) balloons to two or three seconds before the browser even receives the first byte of HTML.
3. Plugin Bloat & Render-Blocking Code
Visual page builders often inject excessive layers of CSS, inline styling, and external JavaScript libraries for minor animation effects. Every single stylesheet and script placed in the <head> of your website forces the browser to halt rendering until that specific file is downloaded and parsed.
4. Third-Party Tracking Scripts & Live Chat Overkill
Installing six different marketing tools—Google Analytics 4, Meta Pixel, Hotjar heatmaps, third-party review widgets, live chat bots, and call tracking snippets—adds massive JavaScript overhead. Live chat tools alone often download 500KB+ of heavy scripts, freezing the main browser thread and driving INP scores into the failure zone.
5. Lack of Proper Browser Caching and Modern Compression
If your web server is not configured to serve assets using modern compression algorithms (Brotli or Gzip), and fails to specify long browser caching policies (Cache-Control: max-age=31536000), recurring visitors are forced to re-download your logos, fonts, and stylesheets every time they navigate to a new page.
The 6-Step Action Blueprint to Achieve a 90+ PageSpeed Score
Achieving a 90+ score on Google PageSpeed Insights does not require rebuilding your entire business model. It requires executing clean, modern web engineering fundamentals.
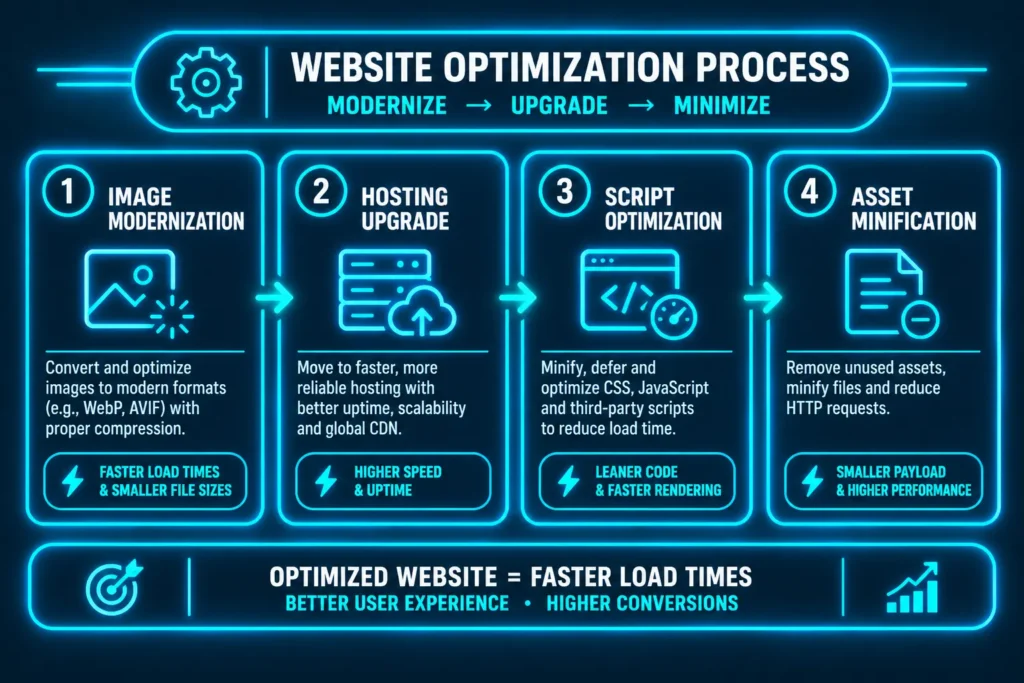
Step 1: Modernize and Compress All Images (WebP/AVIF Conversion)
Images should account for no more than 500KB to 800KB of your page’s total weight.
- Convert to WebP or AVIF: Modern formats provide 30% to 50% better compression than traditional JPEG or PNG without noticeable quality loss.
- Serve Scaled Responsive Images: Ensure your CMS serves appropriately sized images based on the user’s screen size using
srcsetattributes (do not serve a 2560px desktop image to a 390px mobile screen). - Explicit Width and Height Attributes: Always declare explicit
widthandheightdimensions in your<img>tags to eliminate layout shift (CLS). - Native Lazy Loading: Apply
loading="lazy"to all images below the fold, while ensuring the hero image (LCP element) loads eagerly withfetchpriority="high".
HTML

Step 2: Upgrade to High-Performance Cloud Hosting (Lower TTFB)
Migrate away from budget shared hosting plans. Move your website to managed cloud infrastructure powered by Google Cloud, AWS, or DigitalOcean (such as Cloudways, Kinsta, WP Engine, or modern Webflow native infrastructure).
- Target a Time to First Byte (TTFB) under 200ms.
- Utilize an edge-caching Content Delivery Network (CDN) like Cloudflare to serve cached copies of your static files from servers located geographically closest to your local customers.
Step 3: Eliminate Render-Blocking Resources
- Defer Non-Critical JavaScript: Ensure all non-essential scripts carry the
deferorasyncattribute so the browser can construct the visual page without waiting for scripts to download. - Inline Critical CSS: Extract the minimal CSS required to render the top hero section of the page and inline it directly into the HTML document header, loading the remainder of your stylesheet asynchronously.
- Self-Host Google Fonts: Downloading external fonts from Google’s servers introduces extra DNS lookups. Download the
.woff2font files, host them locally on your server, and applyfont-display: swapin your CSS to prevent invisible text during loading.
Step 4: Streamline Third-Party Scripts & Live Chat
- Audit Plugins: Audit your CMS and permanently delete inactive or redundant plugins.
- Delay Heavy Chat Widgets: Configure your live chat widgets to load dynamically only after the user scrolls 20% down the page or after a 3-second delay, freeing up the initial loading thread for critical content.
- Use Google Tag Manager Cleanly: Avoid firing unnecessary tracking tags on every single page load.
Step 5: Enable Server-Level Brotli Compression & Object Caching
- Deploy Brotli Compression: Ensure your web server compresses HTML, CSS, and JS using Brotli (which outperforms standard Gzip by 15–20%).
- Activate Redis / Memcached: If using WordPress, activate persistent object caching to store database query results in RAM, reducing backend database processing load during traffic surges.
Step 6: Minify HTML, CSS, and JavaScript
Strip out white spaces, code comments, and redundant declarations from all frontend assets. Minification reduces the physical file size of your codebase, allowing faster network transit over mobile connections.
Real-World Case Study: Speed Optimization Drives Local Leads
To demonstrate the real financial impact of website speed, consider this performance data from an auto repair and detailing shop operating in a competitive regional market:
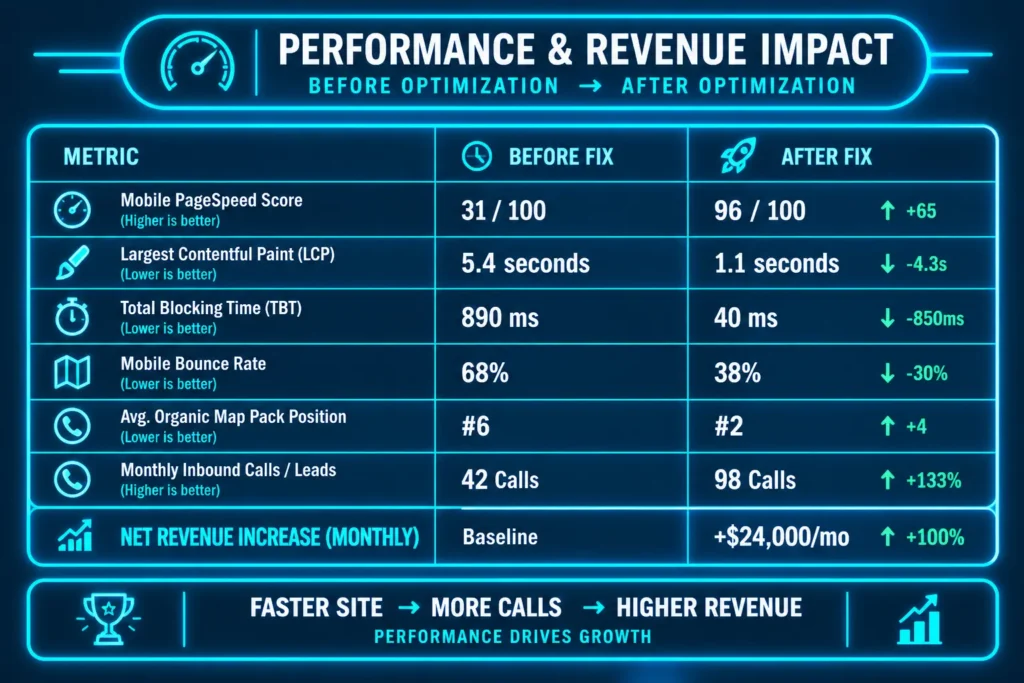
By resolving heavy image files, removing bloated plugins, and moving to an edge-cached cloud environment, the business improved its mobile loading speed by over four seconds.
The lower bounce rate and superior Core Web Vitals performance signaled positive user engagement to Google, boosting the company into the Top 3 Map Pack. The resulting lead volume more than doubled without spending an additional cent on advertising.
📊 Want Your Website Running at 90+ PageSpeed?
Stop losing potential clients to sluggish loading times. Let our web performance engineers clean up your technical code and optimize your site for maximum speed and conversion.
Testing Your Performance: Essential Tools to Use
To monitor your website’s speed accurately, use these industry-standard diagnostic tools rather than relying on your personal phone or computer cache:
- Google PageSpeed Insights (web.dev): The official benchmark tool measuring both lab performance data and real-world Chrome User Experience Report (CrUX) metrics.
- GTmetrix: Provides a detailed waterfall chart showing the exact file-by-file loading sequence, making it easy to identify sluggish plugins and uncompressed images.
- WebPageTest.org: Allows you to test your website’s performance across real physical mobile devices running on specific 4G/LTE connection speeds in specific US cities.
How CodixMedia Builds Blazing-Fast Local Lead Engines
At CodixMedia, we know that high rankings and strong conversions require a solid technical foundation. We do not build bloated, slow websites that frustrate visitors and drop out of search results.
Our performance and digital growth solutions include:
- Speed Optimization & Core Web Vitals Hardening: Complete code audits, image compression, script deferral, and server-level caching to guarantee 90+ PageSpeed scores.
- High-Speed Web Development: Mobile-first, lightweight Website Development Services designed natively for speed, security, and lead generation.
- Google Business Profile Domination: Full-service Google Business Profile Management to translate technical site authority into local Map Pack visibility.
- Paid Search Acceleration: Fast-loading landing pages engineered to maximize conversion rates and reduce Cost-Per-Click in your PPC Campaigns.
Ready for a Blazing-Fast Website That Dominates Search?
Stop letting a slow website hold back your local market growth. Partner with a team that knows how to resolve technical speed bottlenecks and build high-performance platforms that turn searchers into paying clients.
👉 Schedule Your Strategy Call with CodixMedia Today or review our real-world client case studies on the CodixMedia Portfolio.